ASP.NET Core structured logging – part 2: the infrastructure
Hi and welcome back to the second episode of the Structured Logging with ASP.NET Series! Last time we saw what’s the difference between standard and structured logging. This time instead we’ll start moving away from the theory and see how to setup the infrastructure to host our log entries.
Let’s be honest here, logging to the Console is the first thing we all do. Probably with a call to `Console.Writeline()`. Don’t worry, I won’t judge. And there’s nothing wrong with it, let’s be clear.
Then the next level is leveraging the built-in logging library of .NET Core. And all of a sudden, we start getting instances of_ ILogger<>_ injected in our classes and everything looks much more nice and clean.
But still, we’re logging to the Console. Maybe with fancy colors, scopes, and log levels now, but still, Console.
Later on, when the project grows and things start getting serious, we find ourselves in need of gathering log entries from multiple sources, trying to aggregate them, correlate them, search them.
Regex is not enough: we need a better way to filter and extract the data.
This is basically what differentiates standard from structured logging: we can assign labels, create fields and run queries on them.
One of the most used tools for this job nowadays is Loki in combination with Grafana.
Loki is a horizontally-scalable, highly-available, multi-tenant log aggregation system. We send our entries to it and we can go back to our job, it’ll take care of the rest.
Grafana instead is a super powerful UI we can leverage to query and visualize logs and metrics.
Of course, there’s much more in both of them, but let’s start from the basics.
So, the first step is to get our infrastructure up and running. I took the liberty of bothering the SuperSafeBank repository I’m using for the Event Sourcing Series . I have updated the Docker Compose config file and added two more services:
loki:
    image: grafana/loki:master
    ports:
      - "3100:3100"
    command: -config.file=/etc/loki/local-config.yaml
    networks:
      - loki

  grafana:
    image: grafana/grafana:master
    ports:
      - "3000:3000"
    networks:
      - loki

networks:
  loki:
Now run docker-compose up, open `localhost:3000` in the browser and enjoy this nice and warm welcome:
 </figure>
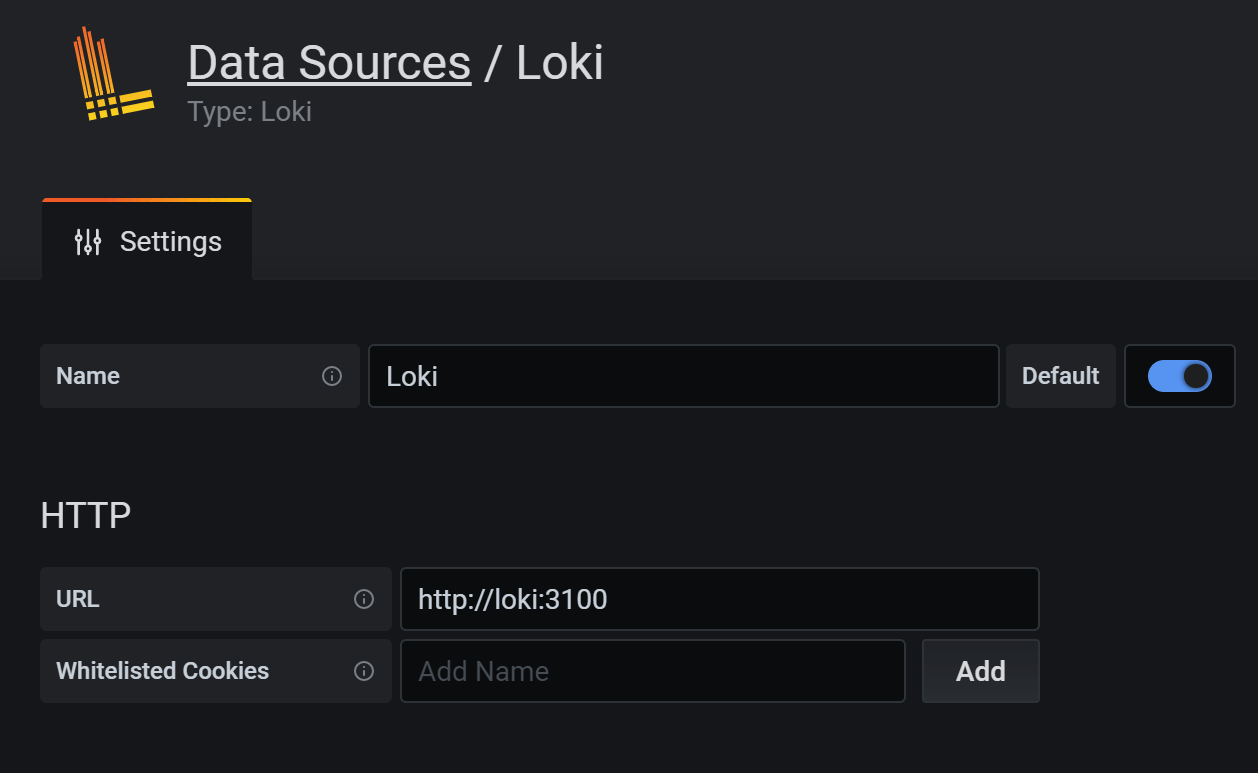
The next step is to go to Configuration -> Data Sources and add our Loki instance:
 </figure>
As you might have noticed, the URL is http://loki:3100 , as both Grafana and Loki are running in the loki network in Docker.
That’s all for now. Next time we’ll see how we can leverage Serilog in our .NET Core applications to send the log entries to Loki.
Did you like this post? Then